
Analytics
Read your statistics at three levels: your whole organization, one event, and one session, from the Overview page to an event's report grid.
Your statistics are read at three levels, your whole organization, one event, and one session, so you can start wide and narrow down to what you are looking for.
How it works
Each analytics page is a dashboard fed by your sales, your orders and your scans. Panels that plot a value over time follow the range selector at the top of the page, while single figures and breakdowns keep the dashboard's own window. Nothing you do on these pages changes your event: they are there to be read.
Your whole organization
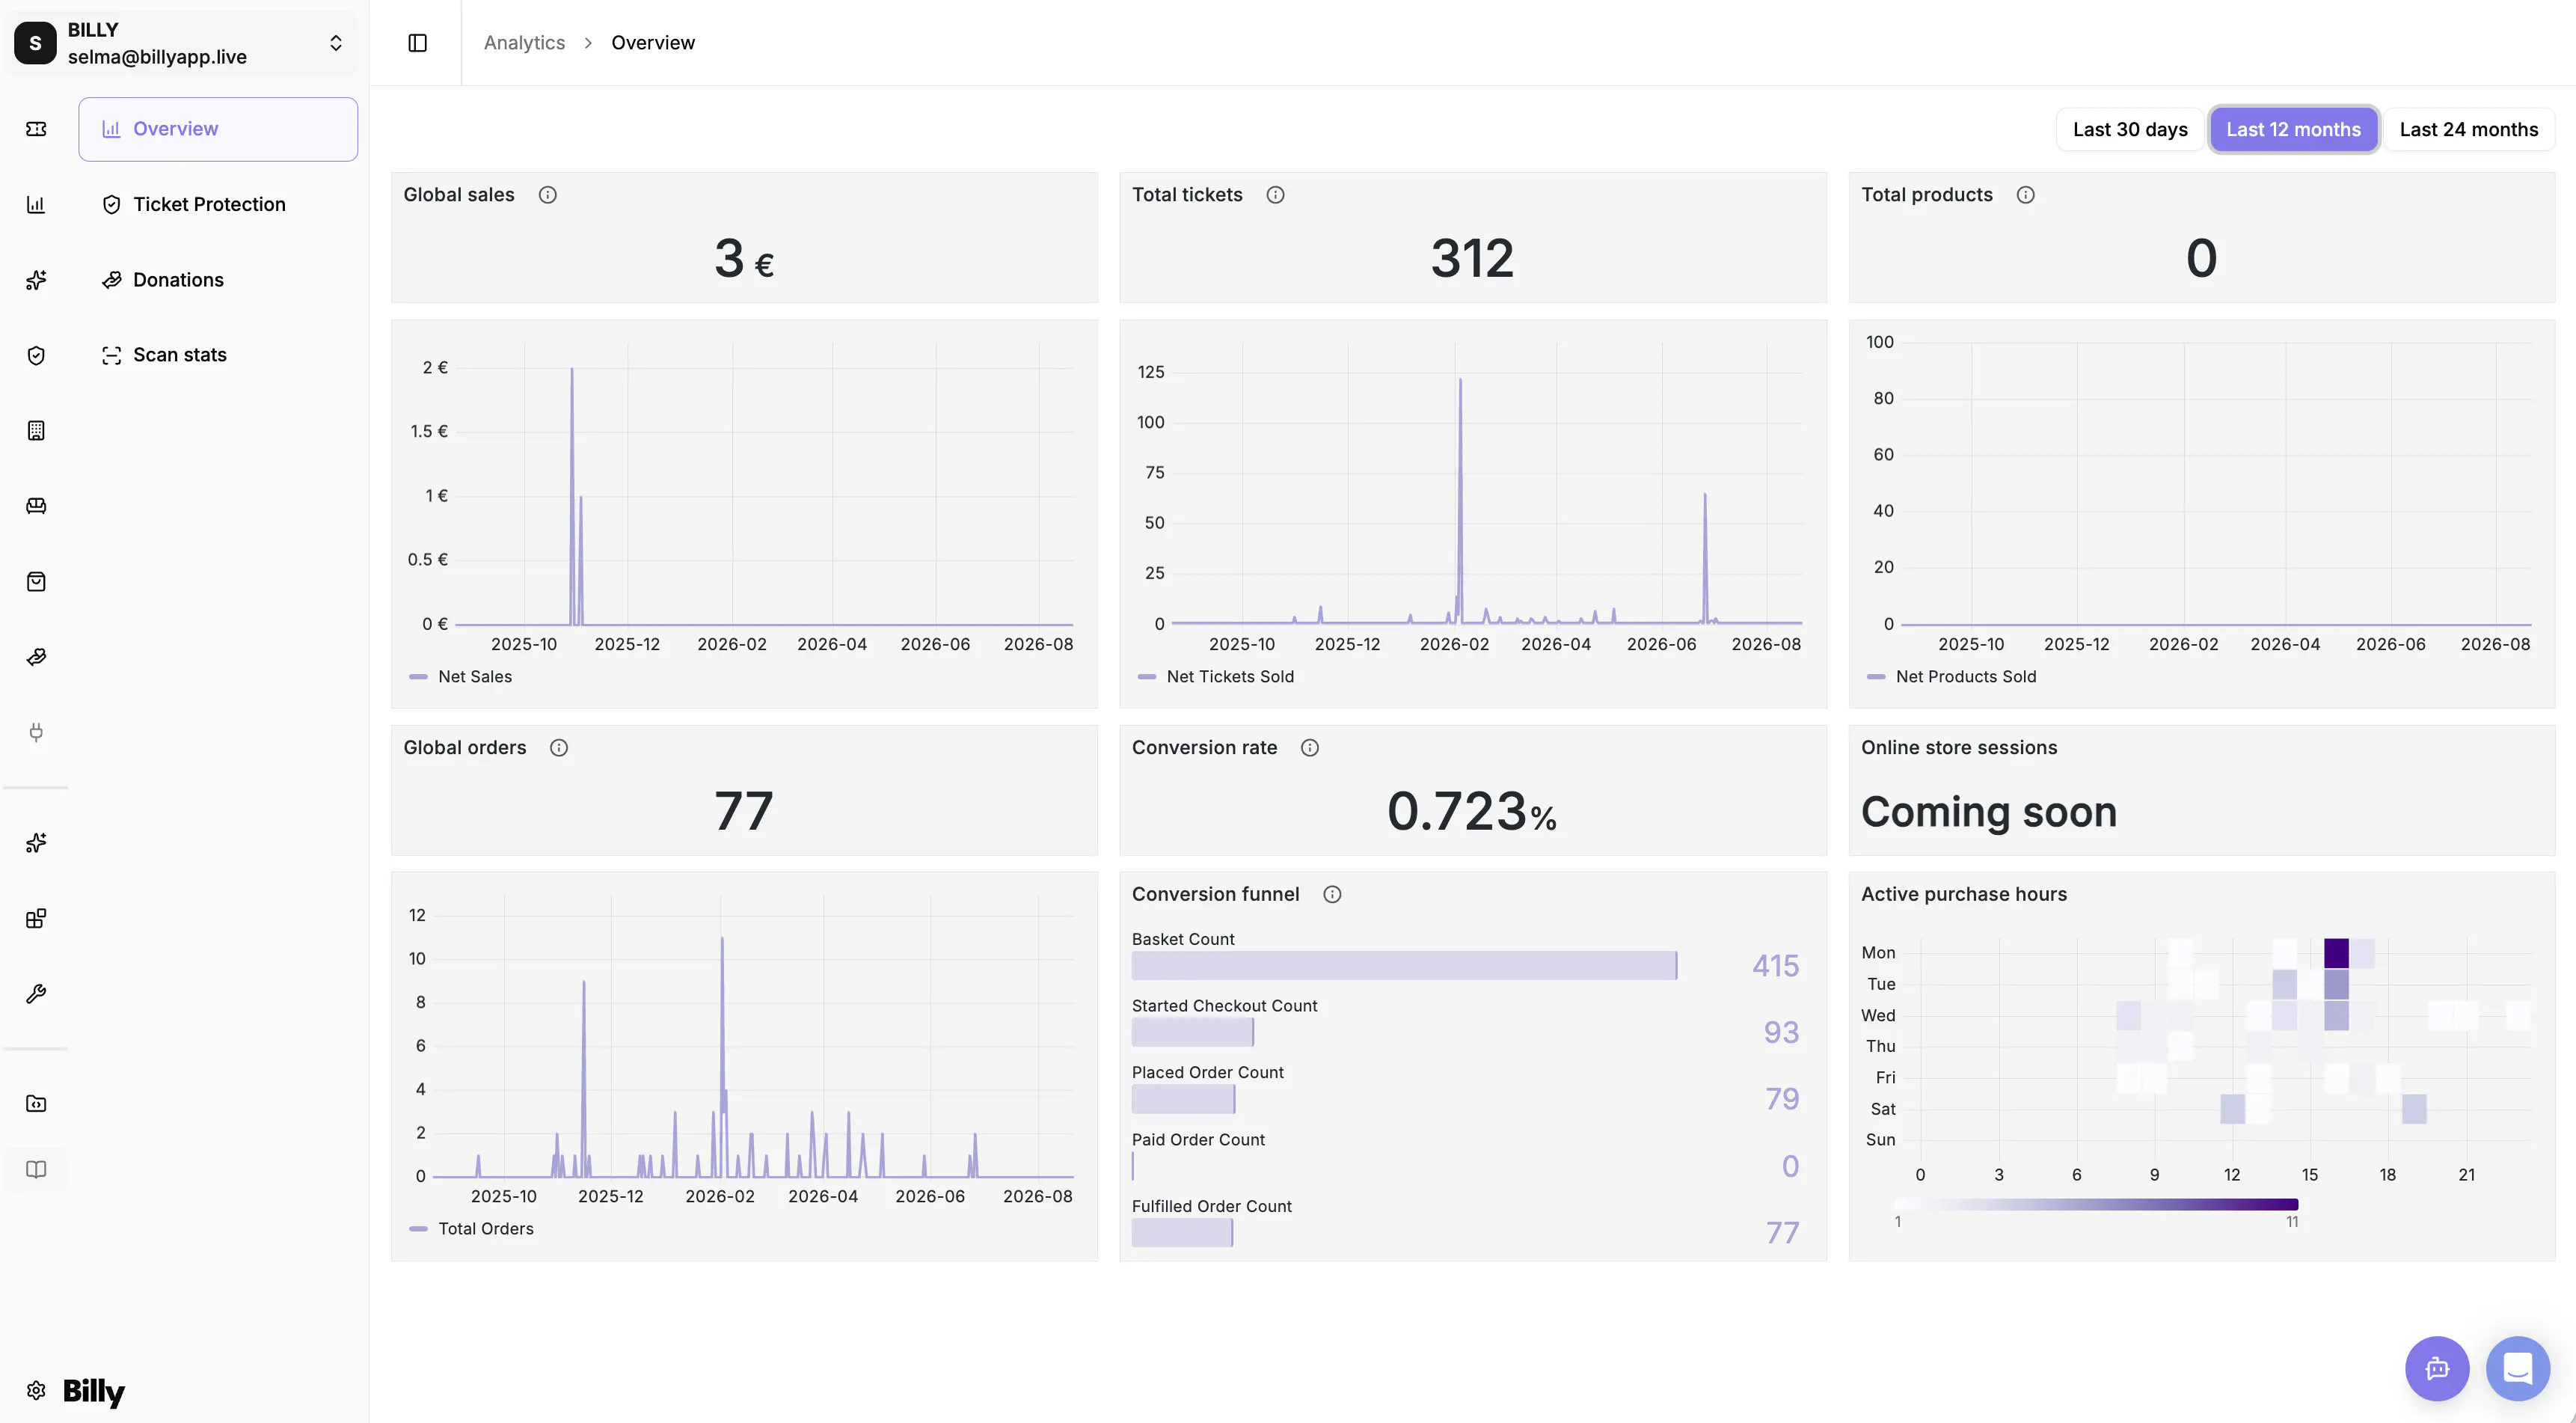
In the studio sidebar, open Analytics. Overview is the wide view of your activity, with Global sales, Total tickets, Total products, Global orders, Conversion rate and Online store sessions, plus a Conversion funnel and your Active purchase hours. Beside it, Ticket Protection and Donations follow those two options across your events, and Scan stats follows check-ins in real time, for one event or for All events.

One event
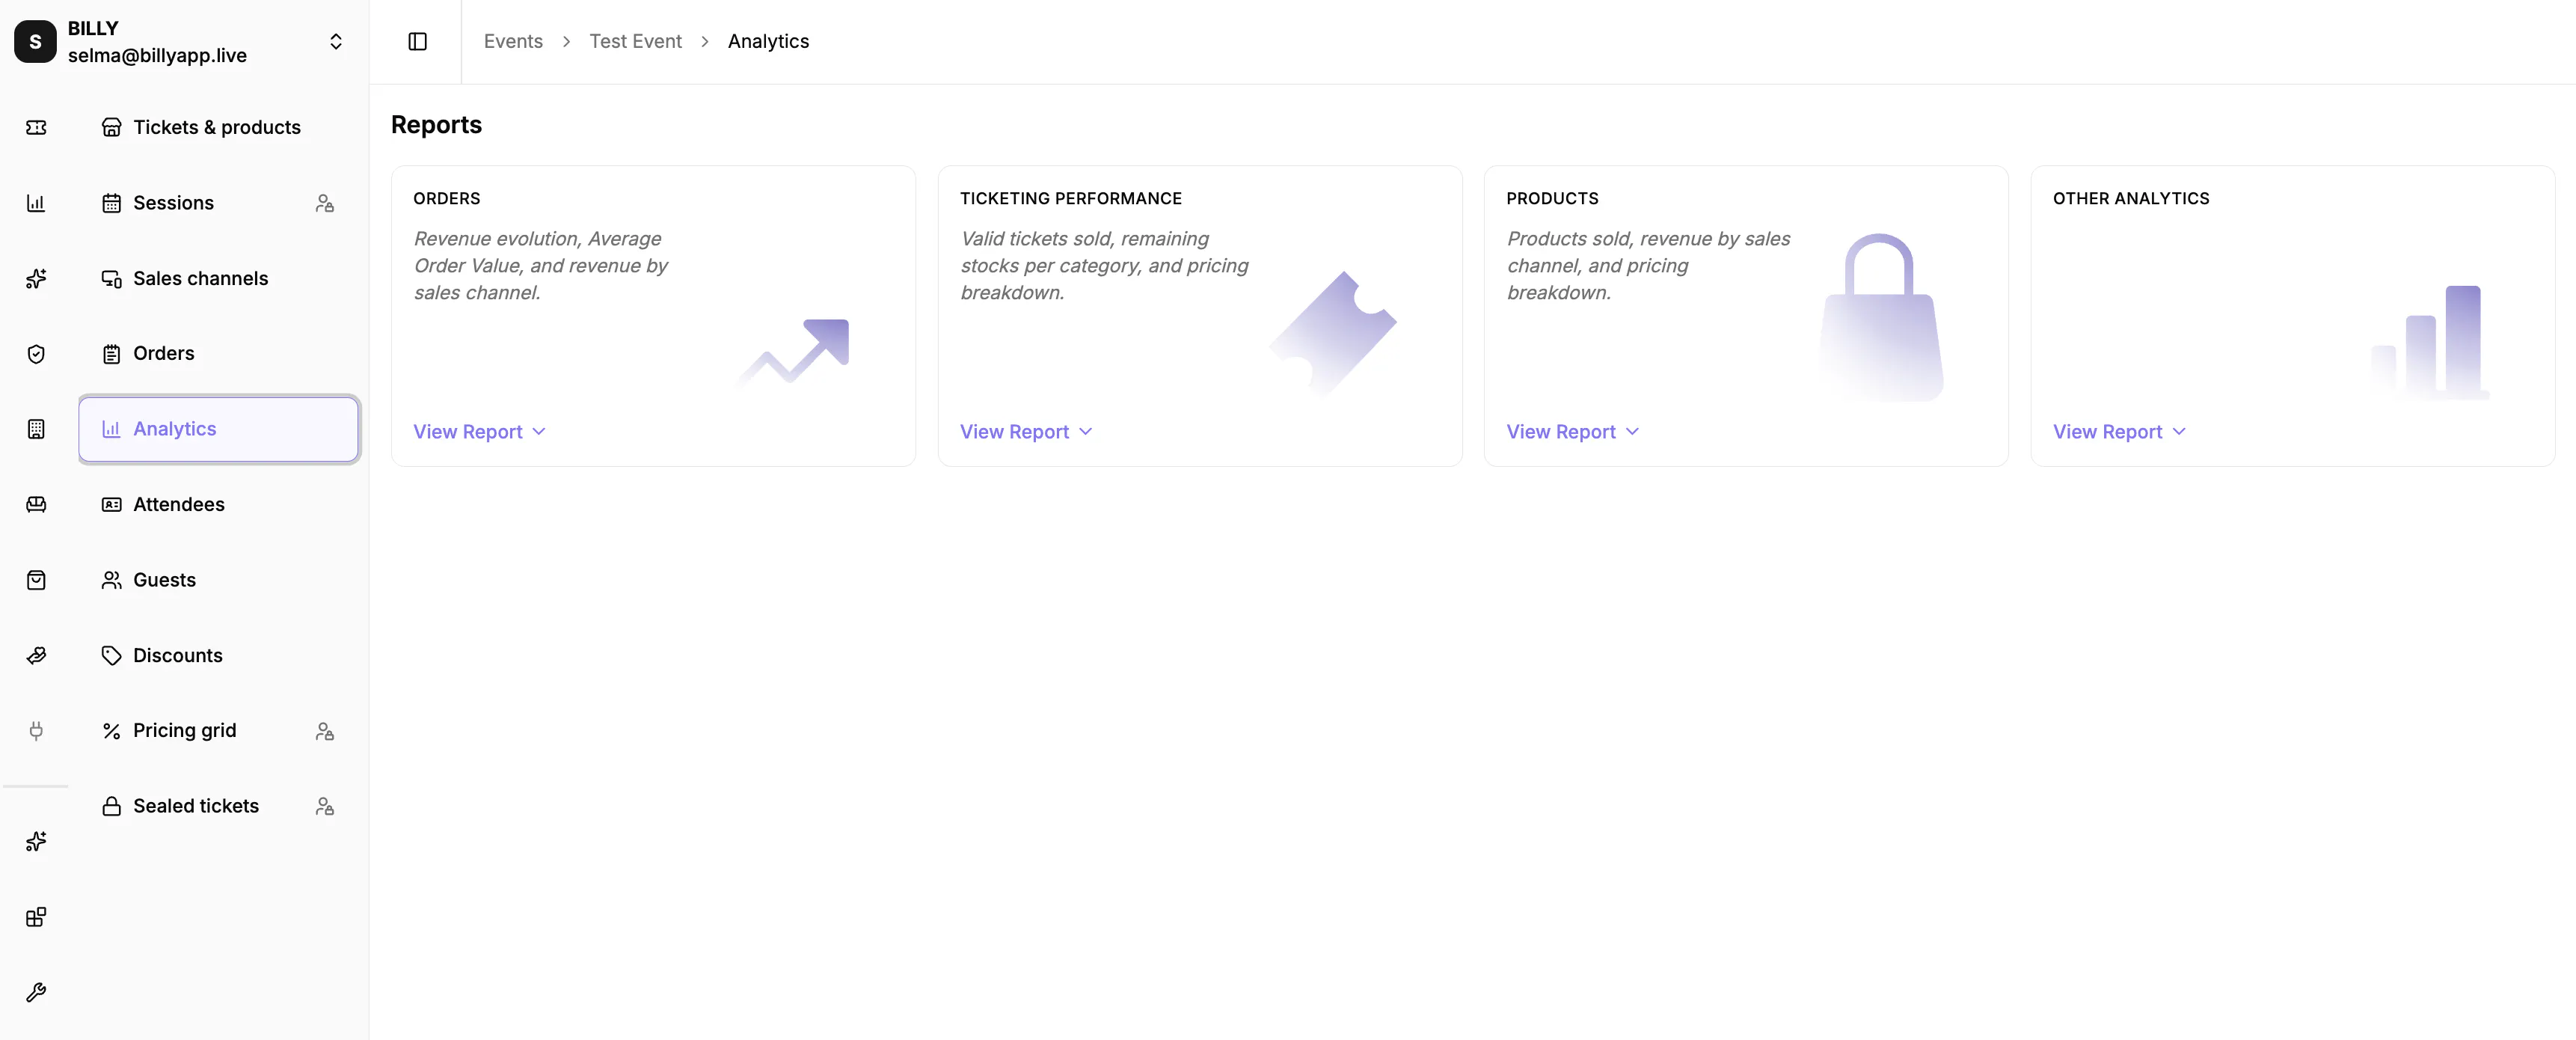
Open an event, then Analytics. Four reports are offered: Orders for revenue evolution, average order value and revenue by sales channel, Ticketing performance for valid tickets sold, remaining stock per category and pricing breakdown, Products for products sold and their revenue, and Other analytics for the conversion funnel, the conversion rate, the postal codes map and the order heatmap. Click a report to open its panels below the grid. The event's Orders, Discounts and Attendees pages carry their own dashboards too, right above the list they describe.

One session
Statistics for a single session are coming. Until then, an event running several dates is read as a whole in its reports.